Note
Go to the end to download the full example code.
Using example data: Threshold realizations to get probabilities#
This is an example of thresholding a input containing realizations or ensemble members using data from the improver_example_data package. The thresholding will be applied to each ensemble member/realization independently. The realization dimension can then be collapsed.
# Authors: The IMPROVER developers
# SPDX-License-Identifier: BSD-3-Clause
Load example data#
Load example realization data for thresholding.
from improver import example_data_path
from improver.utilities.load import load_cube

# Get the path to an example file with realizations
data_path = example_data_path(
    "threshold", "20251120T1500Z-PT0060H00M-wind_speed_at_10m.nc"
)

# Load the cube
realization_cube = load_cube(str(data_path))

print(realization_cube)
/home/docs/checkouts/readthedocs.org/user_builds/improver/conda/2238/lib/python3.13/site-packages/iris/common/mixin.py:206: FutureWarning: You are using legacy date precision for Iris units - max precision is seconds. In future, Iris will use microsecond precision - available since cf-units version 3.3 - which may affect core behaviour. To opt-in to the new behaviour, set `iris.FUTURE.date_microseconds = True`.
  warnings.warn(message, category=FutureWarning)
wind_speed / (m s-1)                (realization: 3; projection_y_coordinate: 970; projection_x_coordinate: 1042)
    Dimension coordinates:
        realization                             x                           -                             -
        projection_y_coordinate                 -                           x                             -
        projection_x_coordinate                 -                           -                             x
    Scalar coordinates:
        forecast_period             216000 seconds
        forecast_reference_time     2025-11-18 03:00:00
        height                      10.0 m
        time                        2025-11-20 15:00:00
    Attributes:
        Conventions                 'CF-1.7, UKMO-1.0'
        history                     '2025-11-18T05:13:56Z: StaGE Decoupler'
        institution                 'Met Office'
        least_significant_digit     np.int64(1)
        mosg__forecast_run_duration 'PT126H'
        mosg__grid_domain           'uk_extended'
        mosg__grid_type             'standard'
        mosg__grid_version          '2.4.0'
        mosg__model_configuration   'uk_ens'
        source                      'Met Office Unified Model'
        title                       'MOGREPS-UK Model Forecast on UK 2 km Standard Grid'
        um_version                  '13.1'
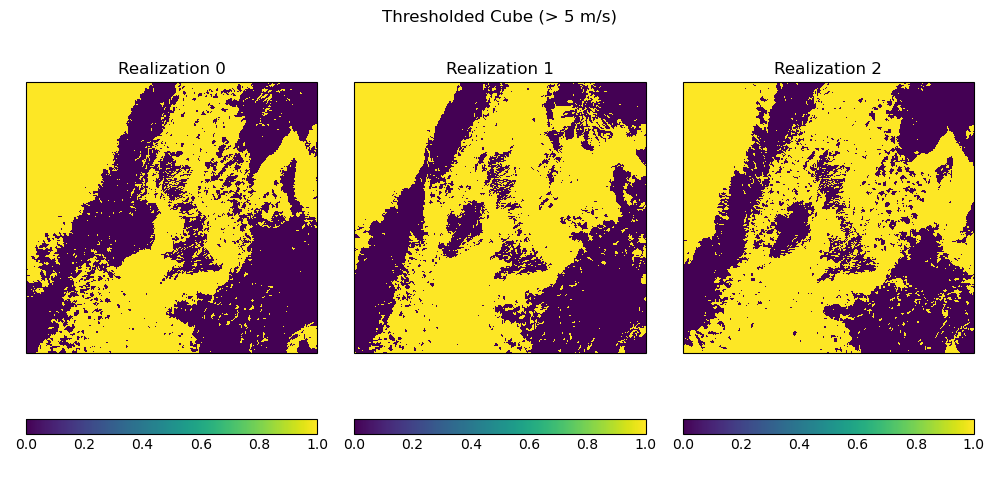
Threshold the example cube at 5 m/s.
from improver.threshold import Threshold

thresholded_cube = Threshold(threshold_values=5, comparison_operator=">")(
    realization_cube
)
Plot of the probability of exceeding 5 m/s for each realization. Note that these are binary fields (0s and 1s).
import iris.quickplot as qplt
import matplotlib.pyplot as plt

plt.figure(figsize=(10, 5))
for i in range(thresholded_cube.coord("realization").points.size):
    plt.subplot(1, 3, i + 1)
    qplt.pcolormesh(thresholded_cube[i])
    plt.title(f"Realization {i}")
plt.suptitle("Thresholded Cube (> 5 m/s)")
plt.tight_layout()
plt.show()
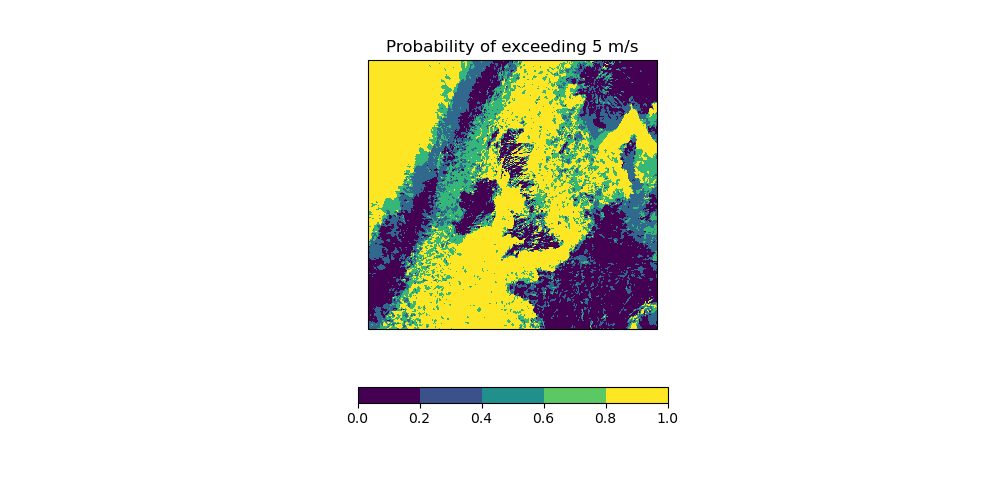
Collapse the realization dimension as part of thresholding.
from improver.threshold import Threshold

collapsed_cube = Threshold(
    threshold_values=5, comparison_operator=">", collapse_coord="realization"
)(realization_cube)
Plot the probabilities of exceeding 5 m/s after collapsing the realization dimension. Note that these probabilities are now non-binary with areas of intermediate values, for example, to the north and west of Ireland.
import iris.quickplot as qplt
import matplotlib as mpl
import matplotlib.pyplot as plt
import numpy as np

plt.figure(figsize=(10, 5))
qplt.pcolormesh(collapsed_cube, colorbar=False)
cmap = mpl.cm.viridis
norm = mpl.colors.BoundaryNorm(np.arange(0, 1.1, 0.2), cmap.N)
plt.colorbar(
    mpl.cm.ScalarMappable(norm=norm, cmap=cmap),
    ax=plt.gca(),
    orientation="horizontal",
    shrink=0.4,
)
plt.title("Probability of exceeding 5 m/s")
plt.show()
Total running time of the script: (0 minutes 3.054 seconds)