Note
Go to the end to download the full example code.
Simple example: Threshold realizations to get probabilities#
This is an example of thresholding a input containing realizations or ensemble members. The thresholding will be applied to each ensemble member/realization independently. The realization dimension can then be collapsed.
# Authors: The IMPROVER developers
# SPDX-License-Identifier: BSD-3-Clause
Generate data#
Generate a synthetic dataset for thresholding.
import numpy as np

from improver.synthetic_data.set_up_test_cubes import set_up_variable_cube

# Create a 3x3x3 3D numpy array with random values
data = np.array(
    [
        [[1, 2, 3], [4, 5, 6], [7, 8, 9]],
        [[2, 3, 4], [5, 6, 7], [8, 9, 10]],
        [[3, 4, 5], [6, 7, 8], [9, 10, 11]],
    ]
)

realization_cube = set_up_variable_cube(data=data, units="m/s")
Threshold the example cube at 5 m/s.
from improver.threshold import Threshold

thresholded_cube = Threshold(threshold_values=5, comparison_operator=">")(
    realization_cube
)
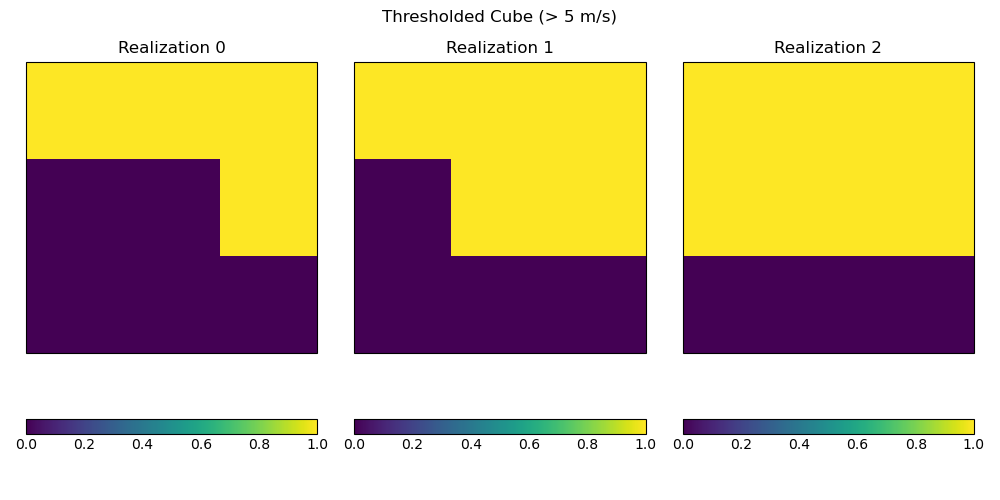
Plot of the probability of exceeding 5 m/s for each realization. Note that these are binary fields (0s and 1s).
import iris.quickplot as qplt
import matplotlib.pyplot as plt

plt.figure(figsize=(10, 5))
for i in range(thresholded_cube.coord("realization").points.size):
    plt.subplot(1, 3, i + 1)
    qplt.pcolormesh(thresholded_cube[i])
    plt.title(f"Realization {i}")
plt.suptitle("Thresholded Cube (> 5 m/s)")
plt.tight_layout()
plt.show()
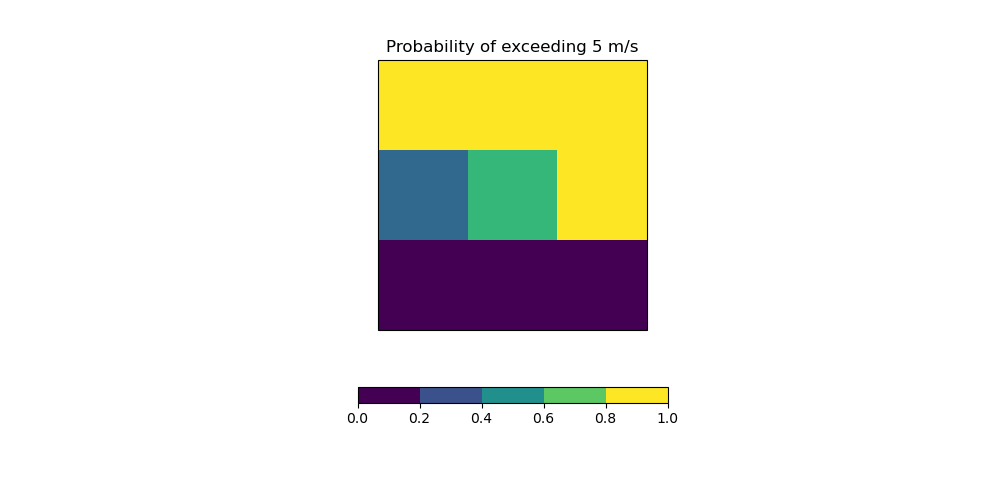
Collapse the realization dimension as part of thresholding.
from improver.threshold import Threshold

collapsed_cube = Threshold(
    threshold_values=5, comparison_operator=">", collapse_coord="realization"
)(realization_cube)
Plot the probabilities of exceeding 5 m/s after collapsing the realization dimension. Note that these probabilities are now non-binary. The centre-left grid square has a probability of 1/3 as only one out of the three realizations exceeded 5 m/s. The centre grid square has a probability of 2/3 as two out of the three realizations exceeded 5 m/s.
import iris.quickplot as qplt
import matplotlib as mpl
import matplotlib.pyplot as plt

plt.figure(figsize=(10, 5))
qplt.pcolormesh(collapsed_cube, colorbar=False)
cmap = mpl.cm.viridis
norm = mpl.colors.BoundaryNorm(np.arange(0, 1.1, 0.2), cmap.N)
plt.colorbar(
    mpl.cm.ScalarMappable(norm=norm, cmap=cmap),
    ax=plt.gca(),
    orientation="horizontal",
    shrink=0.4,
)
plt.title("Probability of exceeding 5 m/s")
plt.show()
Total running time of the script: (0 minutes 0.215 seconds)